Linux 系统性能分析工具集
Linux 系统中提供众多的性能分析工具,常见的工具如下表:
| 软件包名 | 简介 |
|---|---|
| latencytop | 是一个监测工具,用于报告系统和应用程序中与等待时间相关的统计信息。 |
| memstat | 分析了应用层内存使用的情况,并从匿名页和文件页两个角度给出了详尽的数据。 |
| vmtouch | 是一个控制文件系统page cache的小工具,可以将文件纳入page cache中,也可以驱逐出去。 |
| fio | 是一个测试IO性能的工具,从各个方面测试了IO的性能数据。 |
| blktrace | 是一个用于跟踪Block Layer函数调用以及耗费时间的工具。 |
| iostat | 是一个查看当前各block设备IO状态的工具。 |
| iozone | 可以对block设备上的文件系统进行测试。 |
| lmbench | 是一个全面测试系统性能的工具。 |
| nmon | 是一个综合性的系统性能观测工具。 |
| iperf3 | 是一个用于测量网络性能的工具。 |
| pv | 是一个 用于显示命令在执行时的进度条的工具。 |
| dieharder | 是一个用于测试随机数生成能力的工具。 |
上述工具都可以通过apt install的方式安装,详情请见 包管理
如果apt install安装失败,可以尝试apt update后,再apt install
latencytop
LatencyTOP 是一个监测工具,用于报告系统和应用程序中与等待时间相关的统计信息。此工具报告系统中以及系统上正在运行的应用程序中等待时间的发生位置和类型的相关统计信息。可以根据该统计信息来消除所查明的等待时间,从而提高应用程序和系统的性能吞吐量。
此工具定期分析系统活动,并在输出窗口中显示数据。将跟踪两种类型的等待时间:进入休眠状态和从休眠状态唤醒的 LWP,以及调整顺序以获取同步对象的 LWP。此工具使用 Solaris DTrace 框架收集与系统和应用程序 LWP 的这两种非活动情况相对应的统计信息。
输出窗口分成两部分。上部分显示系统范围的统计信息,而下部分显示有关各个进程的统计信息。用户可使用向左方向键和向右方向键在进程列表中导航,并选择感兴趣的列表。然后此工具会在窗口下部分中显示该选定进程的相关统计信息。如果按下 t 或 T 键,此工具将显示该选定进程的特定于 LWP 的视图。可使用 t 或 T 键在进程视图和线程视图之间进行切换。
执行期间,用户可通过按下 r 或 R 键强制刷新分析结果。间隔时间将恢复为缺省值或指定值(如果使用 -t)。要退出应用程序,用户必须按下 q 或 Q 键。
内核需要开启 CONFIG_LATENCYTOP
apt install -y latencytop
latencytop 可以观察一定时间内,每一个进程在运行过程中发生的调度的次数和原因分布
   LatencyTOP version 0.5       (C) 2008 Intel Corporation

Cause                                                Maximum     Percentage
Waiting for a process to die                        3.8 msec         29.4 %
Waiting for event (select)                          3.7 msec         53.6 %
Waiting for TTY to finish sending                   1.3 msec         16.0 %
[__schedule]                                        0.2 msec          0.5 %

Process latencytop (1007)                  Total:   9.1 msec
Waiting for a process to die                        3.8 msec         42.3 %
Waiting for TTY to finish sending                   1.3 msec         55.7 %
[__schedule]                                        0.2 msec          1.9 %

 kworker/1:1-mm_percpu_wq  kworker/0:1H-mmc_complete  haveged  ntpd  latencytop
上面一部分是内核态的,下面一部分对应的是每一个进程
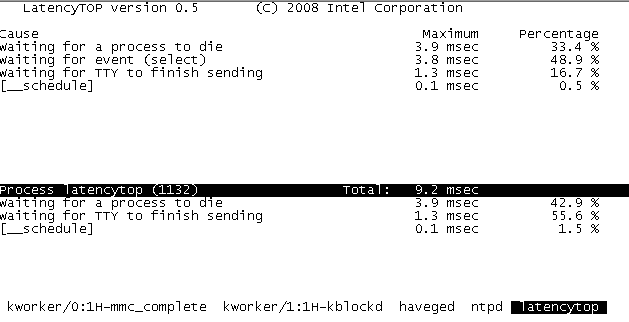
高亮的latencytop表示latencytop这个程序自身在运行过程中发生的进程切换次数和原因分布
memstat
memstat是一个用于观测系统内存使用状况的工具
安装
apt install -y memstat
memstat通过遍历/proc下所有进程,然后解析内存使用情况。通过对比可以发现,memstat不会统计内核线程的内存使用情况,同时memstat也不会统计所有设备使用的内存。memstat 详尽地分析了应用层内存使用的情况,并从匿名页和文件页两个角度给出了详尽的数据。memstat使用:
memstat - 显示整个系统内存使用情况。
memstat -p pid - 显示进程pid的内存使用情况。
显示示例如下:
# memstat
    288k: PID     1 (/bin/busybox)
    288k: PID    69 (/bin/busybox)
    288k: PID    73 (/bin/busybox)
   1752k: PID    78 (/bin/busybox)
   5988k: PID    94 (/usr/sbin/haveged)
  66536k: PID   106 (/usr/sbin/ntpd)
    572k: PID   111 (/usr/sbin/sshd)
    288k: PID   116 (/bin/busybox)
    672k: PID   117 (/bin/bash)
    300k: PID   894 (/usr/bin/memstat)
    536k(    516k): /bin/bash 117
   1284k(   1224k): /bin/busybox 1 69 73 78 116 1 69 73 78 116
    144k(     92k): /lib/ld-2.29.so 78 94 106 111 117 894 78 94 106 111 117 ...
     40k(     16k): /lib/libatomic.so.1.2.0 106 111 106 111 106 111
   1196k(   1028k): /lib/libc-2.29.so 78 94 106 111 117 894 78 94 106 111 11...
     36k(     24k): /lib/libcrypt-2.29.so 111
     32k(      8k): /lib/libdl-2.29.so 106 111 117 106 111 117 106 111 117
     76k(     68k): /lib/libgcc_s.so.1 106
    528k(    520k): /lib/libm-2.29.so 106
     24k(     16k): /lib/libnss_dns-2.29.so 106
     64k(     32k): /lib/libnss_files-2.29.so 78 106 111 117 78 106 111 117 ...
     96k(     80k): /lib/libpthread-2.29.so 106 111 106 111 106 111
     76k(     52k): /lib/libresolv-2.29.so 106 111 106 111 106 111
     16k(      8k): /lib/libutil-2.29.so 111
     16k(      8k): /usr/bin/memstat 894
   1868k(   1516k): /usr/lib/libcrypto.so.1.1 106 111 106 111 106 111
     92k(     84k): /usr/lib/libhavege.so.1.1.0 94
     32k(     24k): /usr/lib/libhistory.so.8.0 117
    264k(    240k): /usr/lib/libncursesw.so.6.1 117
    236k(    200k): /usr/lib/libreadline.so.8.0 117
    456k(    344k): /usr/lib/libssl.so.1.1 106 111 106 111 106 111
     68k(     60k): /usr/lib/libz.so.1.2.11 111
     24k(     16k): /usr/sbin/haveged 94
    572k(    536k): /usr/sbin/ntpd 106
    520k(    504k): /usr/sbin/sshd 111
vmtouch
vmtouch 是一个可以操纵page cache的工具,它可以查看一个文件占用了多少 page cache,可以让一个文件完全浸泡在 page cache 里,也可以让一个文件完全从 page cache 中剥离出来
安装
apt install -y vmtouch
# vmtouch uImage
           Files: 1
     Directories: 0
  Resident Pages: 0/3433  0/13M  0%
         Elapsed: 0.000499 seconds

# free -m
              total        used        free      shared  buff/cache   available
Mem:           3448          67        3371           0           9        3368
Swap:             0           0           0
uImage 文件存放在 eMMC 上,通过 vmtouch 工具可见,uImage 大小为3433个pages,约13M,此时并没有占用 page cache
同时可以看到,此时的 free 内存为3371M
然后使用 vmtouch 将 uImage 完全纳入 page cache
# vmtouch -t uImage
           Files: 1
     Directories: 0
   Touched Pages: 3433 (13M)
         Elapsed: 0.61707 seconds
# free -m
              total        used        free      shared  buff/cache   available
Mem:           3448          67        3358           0          22        3363
Swap:             0           0           0
# vmtouch uImage
           Files: 1
     Directories: 0
  Resident Pages: 3433/3433  13M/13M  100%
         Elapsed: 0.001754 seconds
可以看到,uImage 已经完全浸泡在 page cache 中了,并且 free 内存也恰好少了13M
使用
# vmtouch -e uImage
           Files: 1
     Directories: 0
   Evicted Pages: 3433 (13M)
         Elapsed: 0.004634 seconds
# vmtouch uImage
           Files: 1
     Directories: 0
  Resident Pages: 0/3433  0/13M  0%
         Elapsed: 0.000446 seconds
可以将 uImage 从 page cache 中打捞出来
fio
fio是一个用于测量文件系统挂载有文件系统的block设备的性能的工具
安装
apt install -y fio
fio -filename=/dev/emcpowerb \
-iodepth 16 -thread -rw=randread \
-ioengine=psync -bs=4k -size=1G \
-numjobs=1 -runtime=180 \
-group_reporting -name=test1
输出:
test1: (g=0): rw=randread, bs=(R) 4096B-4096B, (W) 4096B-4096B, (T) 4096B-4096B, ioengine=psync, iodepth=16
fio-3.9
Starting 1 thread
Jobs: 1 (f=1): [r(1)][100.0%][r=330MiB/s][r=84.4k IOPS][eta 00m:00s]
test1: (groupid=0, jobs=1): err= 0: pid=167: Thu Jan  1 10:31:36 1970
   read: IOPS=84.9k, BW=332MiB/s (348MB/s)(1024MiB/3087msec)
    clat (usec): min=4, max=329, avg= 6.61, stdev= 3.91
     lat (usec): min=5, max=330, avg= 7.58, stdev= 4.26
    clat percentiles (usec):
     |  1.00th=[    6],  5.00th=[    6], 10.00th=[    6], 20.00th=[    7],
     | 30.00th=[    7], 40.00th=[    7], 50.00th=[    7], 60.00th=[    7],
     | 70.00th=[    7], 80.00th=[    7], 90.00th=[    8], 95.00th=[    8],
     | 99.00th=[    8], 99.50th=[    9], 99.90th=[   70], 99.95th=[  122],
     | 99.99th=[  151]
   bw (  KiB/s): min=334910, max=340294, per=99.46%, avg=337844.33, stdev=2086.47, samples=6
   iops        : min=83727, max=85073, avg=84460.50, stdev=521.51, samples=6
  lat (usec)   : 10=99.57%, 20=0.25%, 50=0.02%, 100=0.10%, 250=0.06%
  lat (usec)   : 500=0.01%
  cpu          : usr=29.16%, sys=69.51%, ctx=772, majf=0, minf=1
  IO depths    : 1=100.0%, 2=0.0%, 4=0.0%, 8=0.0%, 16=0.0%, 32=0.0%, >=64=0.0%
     submit    : 0=0.0%, 4=100.0%, 8=0.0%, 16=0.0%, 32=0.0%, 64=0.0%, >=64=0.0%
     complete  : 0=0.0%, 4=100.0%, 8=0.0%, 16=0.0%, 32=0.0%, 64=0.0%, >=64=0.0%
     issued rwts: total=262144,0,0,0 short=0,0,0,0 dropped=0,0,0,0
     latency   : target=0, window=0, percentile=100.00%, depth=16

Run status group 0 (all jobs):
   READ: bw=332MiB/s (348MB/s), 332MiB/s-332MiB/s (348MB/s-348MB/s), io=1024MiB (1074MB), run=3087-3087msec
可以看到,平均带宽是 332MB/s,平均延迟在 10us,更多参数的设置和解读参见:https://tobert.github.io/post/2014-04-17-fio-output-explained.html
blktrace
内核需要开启CONFIG_BLK_DEV_IO_TRACE
blktrace是一个用于观测和跟踪系统IO状况的工具
安装
apt install -y blktrace
# dd if=/dev/mmcblk0p3 of=/dev/zero bs=512K count=1024000 &
# blktrace /dev/mmcblk0p3 -o - | blkparse -i -
179,3    0        1     0.000000000     9  C  RA 1164800 + 1536 [0]
179,0    0        2     0.000552333   136  A  RA 1166336 + 512 <- (179,3) 1039360
179,3    0        3     0.000554333   136  Q  RA 1166336 + 512 [dd]
179,3    0        4     0.000570000   136  G  RA 1166336 + 512 [dd]
179,3    0        5     0.000574000   136  P   N [dd]
179,3    0        6     0.000578000   136  U   N [dd] 1
179,3    0        7     0.000581333   136  I  RA 1166336 + 512 [dd]
179,3    0        8     0.000627000    45  D  RA 1166336 + 512 [kworker/0:2H]
179,0    0        9     0.001208000   136  A  RA 1166848 + 1024 <- (179,3) 1039872
179,3    0       10     0.001209000   136  Q  RA 1166848 + 1024 [dd]
179,3    0       11     0.001217333   136  G  RA 1166848 + 1024 [dd]
179,3    0       12     0.001220333   136  P   N [dd]
... ...
179,3    0      103     0.171033333    45  D  RA 1174528 + 512 [kworker/0:2H]
CPU0 (179,3):
 Reads Queued:          13,     4352KiB  Writes Queued:           0,        0KiB
 Read Dispatches:       13,     4352KiB  Write Dispatches:        0,        0KiB
 Reads Requeued:         0               Writes Requeued:         0
 Reads Completed:       12,     4608KiB  Writes Completed:        0,        0KiB
 Read Merges:            0,        0KiB  Write Merges:            0,        0KiB
 Read depth:             2               Write depth:             0
 IO unplugs:            13               Timer unplugs:           0

Throughput (R/W): 26947KiB/s / 0KiB/s
Events (179,3): 103 entries
Skips: 0 forward (0 -   0.0%)
其中第六个字段非常有用:每一个字母都代表了 IO 请求所经历的某个阶段
- Q – 即将生成 IO 请求
- G – IO 请求生成
- I – IO 请求进入 IO Scheduler 队列
- D – IO 请求进入 driver
- C – IO 请求执行完毕
而第四个字段表示从走到这一个阶段的时间戳,通过这一信息,可以详尽地分析一个 IO 完整的流程,并分析出瓶颈在哪里
最后,还可以通过 btt 来绘制流程图,这里就不表了
iostat
内核需要开启 CONFIG_TASK_IO_ACCOUNTING
iostat是一个用于观测当前系统IO速度和负载的工具
安装
apt install -y iostat
# iostat -h
iostat v2.2, (C) 1999-2005 by Greg Franks, Zlatko Calusic, Rick Lindsley, Arnaud Desitter
Distributed under the terms of the GPL (see LICENSE file)
Usage: iostat [-cdDpPxh] [disks...] [interval [count]]
options:

        c - print cpu usage info
        d - print basic disk info
        D - print disk utilization info
        p - print partition info also
        P - print partition info only
        x - print extended disk info
        h - this help
# iostat -cdDP
  mmcblk0       mmcblk0p3             cpu
 r/s  w/s   %b   r/s  w/s   %b   us  sy  wt  id
   5    0    2     5    0    2    0   0   7  92
iozone
iozone是一个测量block设备上文件系统性能的测试工具
安装
apt install -y iozone
iozone -a 可以给 ICE 上基于 eMMC 的文件系统进行一个全面测试
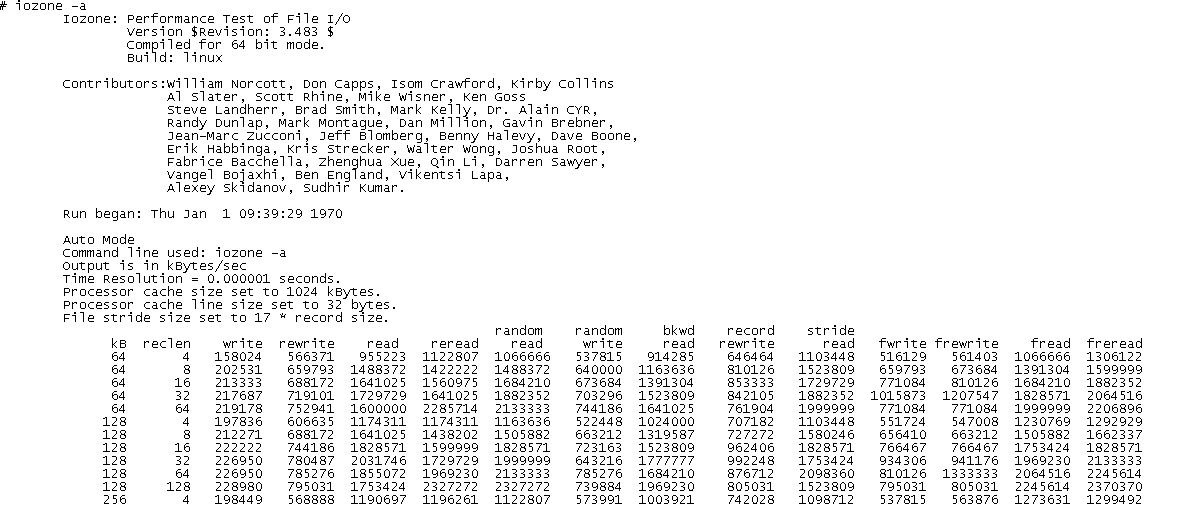
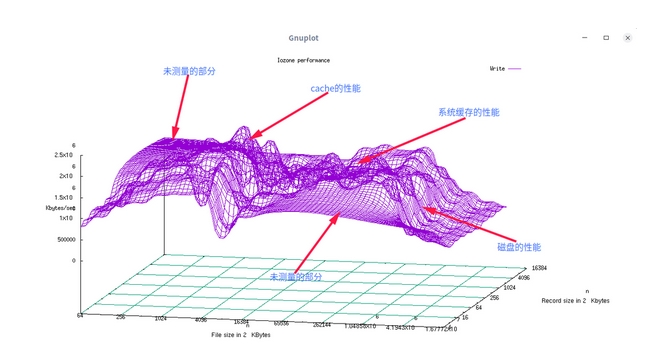
iozone 本身可以生成 excel,结合 gnuplot 之类的画图工具还可以生成更复杂的剖面图
lmbench
lmbench 是一个综合性的性能测量工具集合
安装
apt install -y lmbench
下面介绍一些典型的功能
bw_mem
bw_mem用于测量内存带宽
root@thead-910:~# bw_mem 1M rd
1.00 9565.06
表示测试 1MB数据量的读,速度为 9565MB/s
root@thead-910:~# bw_mem 10M cp
10.00 1218.92
表示测试 10MB数据量的拷贝,速度为 1218MB/s
lat_mem_rd
lat_mem_rd用于测量读内存的延迟
root@thead-910:~# lat_mem_rd 1M
"stride=64
0.00049 2.501
0.00098 2.501
0.00195 2.501
0.00293 2.501
0.00391 2.501
0.00586 2.501
0.00781 2.502
0.01172 2.503
0.01562 2.502
0.02344 2.503
0.03125 2.504
0.04688 3.790
0.06250 6.100
0.09375 6.198
0.12500 6.650
0.18750 6.741
0.25000 6.730
0.37500 6.710
0.50000 6.701
0.75000 6.695
1.00000 6.690
左边一列是读到的数据量(MB),右边一列是读的延时(ns)
mhz
mhz用于测量当前CPU的频率
root@thead-910:~# mhz
1199 MHz, 0.8340 nanosec clock
表示 cpu 运行的频率是 1.2GHz
当然,lmbench 还有很多测试用例,所以可以使用一个来自 ltp 的 lmbench 测试集 lmbench_test.sh(默认在apt install的时候安装),该测试集涵盖了 lmbench 所有的测试用例,跑一遍下来,所有性能参数一目了然,如下:
root@thead-910:~# lmbench_test.sh
|TRACE LOG| ***** STARTING LMBENCH SCRIPT ***** |
|TRACE LOG| CREATING THE FILE OF 16MB SIZE FOR BENCHMARKING|
dd: error writing 'test1.txt': No space left on device
9+0 records in
8+0 records out
|TRACE LOG| ***** STARTING BANDWIDTH BENCHMARKS ***** |
|TRACE LOG| MEMORY BANDWIDTH BENCHMARKS |
|TEST START|bw_mem|
|TRACE LOG| Parameters      : |
|TRACE LOG| Operation       - rd|
|TRACE LOG| Memory Blk Size - 1M|
1.00 9563.10
|TEST RESULT|PASS|bw_mem|
|TEST END|bw_mem|
|TEST START|bw_mem|
|TRACE LOG| Parameters      : |
|TRACE LOG| Operation       - rd|
|TRACE LOG| Memory Blk Size - 2M|
2.00 9172.56
|TEST RESULT|PASS|bw_mem|
|TEST END|bw_mem|
|TEST START|bw_mem|
|TRACE LOG| Parameters      : |
|TRACE LOG| Operation       - rd|
|TRACE LOG| Memory Blk Size - 4M|
... ...
AF_UNIX sock stream bandwidth: 1903.41 MB/sec
|TEST RESULT|PASS|bw_unix|
|TEST END|bw_unix|
|TRACE LOG| BANDWIDTH OF FILE READ|
|TEST START|bw_file_rd|
|TRACE LOG| Parameters      : |
|TRACE LOG| Size            - 1MB|
|TRACE LOG| operation       - open2close|
|TRACE LOG| File            - test1.txt|
1.00 1658.93
|TEST RESULT|PASS|bw_file_rd|
|TEST END|bw_file_rd|
|TEST START|bw_file_rd|
|TRACE LOG| Parameters      : |
|TRACE LOG| Size            - 1MB|
|TRACE LOG| operation       - io_only|
|TRACE LOG| File            - test1.txt|
1.00 1652.89
... ...
"size=128k ovr=26.95
4 7.87
|TEST RESULT|PASS|lat_ctx|
|TEST END|lat_ctx|
|TEST START|lat_ctx|
|TRACE LOG| Parameters      : |
|TRACE LOG| procs           - 4|
|TRACE LOG| size_in_kbytes  - 256K|
|TRACE LOG| repetitions     - 100|
... ...
nmon
nmon 是一个综合性的性能观测工具
安装
apt install -y nmon
输入 nmon 会进入这个画面
+nmon-16g---------------------Hostname=buildroot----Refresh= 0secs ---09:01.14-+
|                                                                              |
|   ------------------------------                                             |
|    _ __  _ __ ___   ___  _ __          For help type H or ...                |
|   | '_ \| '_ ` _ \ / _ \| '_ \          nmon -?  - hint                      |
|   | | | | | | | | | (_) | | | |         nmon -h  - full details              |
|   |_| |_|_| |_| |_|\___/|_| |_|                                              |
|                                        To stop nmon type q to Quit           |
|   ------------------------------                                             |
|                                                                              |
|                                                                              |
|   Use these keys to toggle statistics on/off:                                |
|     c = CPU         l = CPU Long-term     - = Faster screen updates          |
|     C = " WideView  U = Utilisation       + = Slower screen updates          |
|     m = Memory      V = Virtual memory    j = File Systems                   |
|     d = Disks       n = Network           . = only busy disks/procs          |
|     r = Resource    N = NFS               h = more options                   |
|     k = Kernel      t = Top-processes     q = Quit                           |
+------------------------------------------------------------------------------+
再次输入“cUd”可以观测 cpu 使用率,io 使用率等性能参数
+nmon-16g------[H for help]---Hostname=buildroot----Refresh= 2secs ---09:03.30-+
| CPU Utilisation -------------------------------------------------------------|
|---------------------------+-------------------------------------------------+|
|CPU User%  Sys% Wait%  Idle|0          |25         |50          |75       100||
|  1  21.9   2.0   0.0  76.1|UUUUUUUUUU    >                                  ||
|  2   0.5   3.0   0.0  96.5|s         >                                      ||
|---------------------------+-------------------------------------------------+|
|Avg  11.0   2.2   0.0  86.8|UUUUUs >                                         ||
|---------------------------+-------------------------------------------------+|
| CPU Utilisation Stats -------------------------------------------------------|
|ALL    21.9    0.0    4.5  173.3    0.0    0.0    0.0    0.0    0.0    0.0    |
|CPU   User%  Nice%   Sys%  Idle%  Wait% HWirq% SWirq% Steal% Guest% GuestNice%|
|  1    21.9    0.0    2.0   76.2    0.0    0.0    0.0    0.0    0.0    0.0    |
|  2     0.5    0.0    3.0   96.6    0.0    0.0    0.0    0.0    0.0    0.0    |
| Disk I/O --/proc/diskstats----mostly in KB/s-----Warning:contains duplicates-|
|DiskName Busy  Read WriteKB|0          |25         |50          |75       100||
|mmcblk0    0%    0.0    0.0|>                                                ||
|mcblk0p3   0%    0.0    0.0|>                                                ||
|Totals Read-MB/s=0.0      Writes-MB/s=0.0      Transfers/sec=0.0              |
|------------------------------------------------------------------------------|
+------------------------------------------------------------------------------+
iperf3
iperf 用于测量网络性能
安装
apt install -y iperf3
在主机端启动一个 iperf3 server
Microsoft Windows [版本 10.0.18363.1256]
(c) 2019 Microsoft Corporation。保留所有权利。

D:\公司\工具\iperf-3.1.3-win64>iperf3.exe -s
-----------------------------------------------------------
Server listening on 5201
-----------------------------------------------------------
Accepted connection from 192.111.111.11, port 58022
[  5] local 192.111.111.123 port 5201 connected to 192.111.111.11 port 58024
[ ID] Interval           Transfer     Bandwidth
[  5]   0.00-1.00   sec  11.3 MBytes  94.8 Mbits/sec
[  5]   1.00-2.00   sec  11.1 MBytes  92.9 Mbits/sec
[  5]   2.00-3.00   sec  11.3 MBytes  94.4 Mbits/sec
[  5]   3.00-4.00   sec  11.3 MBytes  94.9 Mbits/sec
[  5]   4.00-5.00   sec  11.3 MBytes  94.9 Mbits/sec
[  5]   5.00-6.00   sec  11.3 MBytes  94.9 Mbits/sec
[  5]   6.00-7.00   sec  11.3 MBytes  94.9 Mbits/sec
[  5]   7.00-8.00   sec  11.3 MBytes  94.9 Mbits/sec
[  5]   8.00-9.00   sec  11.3 MBytes  94.9 Mbits/sec
[  5]   9.00-10.00  sec  11.3 MBytes  94.9 Mbits/sec
在板端启动一个 iperf3 测试程序
# iperf3 -c 192.111.111.123
Connecting to host 192.111.111.123, port 5201
[  5] local 192.111.111.11 port 58024 connected to 192.111.111.123 port 5201
[ ID] Interval           Transfer     Bitrate         Retr  Cwnd
[  5]   0.00-1.00   sec  11.6 MBytes  96.8 Mbits/sec    0   92.7 KBytes
[  5]   1.00-2.00   sec  11.0 MBytes  92.5 Mbits/sec    0   92.7 KBytes
[  5]   2.00-3.00   sec  11.3 MBytes  94.6 Mbits/sec   54   94.1 KBytes
[  5]   3.00-4.00   sec  11.4 MBytes  95.6 Mbits/sec    0   98.4 KBytes
[  5]   4.00-5.00   sec  11.3 MBytes  94.6 Mbits/sec    0    115 KBytes
[  5]   5.00-6.00   sec  11.3 MBytes  95.1 Mbits/sec    0    115 KBytes
[  5]   6.00-7.00   sec  11.4 MBytes  95.6 Mbits/sec    0    115 KBytes
[  5]   7.00-8.00   sec  11.3 MBytes  94.6 Mbits/sec    0    137 KBytes
[  5]   8.00-9.00   sec  11.4 MBytes  95.6 Mbits/sec    0    137 KBytes
[  5]   9.00-10.00  sec  11.4 MBytes  95.6 Mbits/sec    0    137 KBytes
就可以测试网络性能了
pv
pv可以用来显示命令在执行时的进度条
安装
apt install -y pv
例如拷贝文件(把testfile1拷贝为testfile2),就可以用pv命令来代替:
root@thead-910:~# dd if=/dev/zero of=testfile1 bs=1M count=128
root@thead-910:~# pv testfile1 > testfile2
27.6KiB 0:00:00 [ 130MiB/s] [================================>] 100%
而且pv还能限制传输的速度,例如1KB/s
root@thead-910:~# pv -L 1k testfile1 > testfile2
  10KiB 0:00:10 [1011 B/s] [===========>                       ] 36% ETA 0:00:17
或者dd:
root@thead-910:~# pv < /dev/mmcblk0p3 | dd of=/tmp/testfile bs=4M
 662MiB 0:00:02 [ 198MiB/s] [====>                             ] 17% ETA 0:00:09
dieharder
dieharder 是一款用于测试随机数生成能力的测试工具
安装
apt install -y dieharder
root@thead-910:~# dieharder -a
#=============================================================================#
#            dieharder version 3.31.1 Copyright 2003 Robert G. Brown          #
#=============================================================================#
   rng_name    |rands/second|   Seed   |
        mt19937|  3.34e+07  | 273137300|
#=============================================================================#
        test_name   |ntup| tsamples |psamples|  p-value |Assessment
#=============================================================================#
   diehard_birthdays|   0|       100|     100|0.08654260|  PASSED
      diehard_operm5|   0|   1000000|     100|0.76268865|  PASSED
  diehard_rank_32x32|   0|     40000|     100|0.09896061|  PASSED
    diehard_rank_6x8|   0|    100000|     100|0.79845879|  PASSED
   diehard_bitstream|   0|   2097152|     100|0.90976807|  PASSED
        diehard_opso|   0|   2097152|     100|0.90149754|  PASSED
        diehard_oqso|   0|   2097152|     100|0.60943983|  PASSED
         diehard_dna|   0|   2097152|     100|0.28147819|  PASSED
diehard_count_1s_str|   0|    256000|     100|0.87571086|  PASSED
diehard_count_1s_byt|   0|    256000|     100|0.32803443|  PASSED
 diehard_parking_lot|   0|     12000|     100|0.43004782|  PASSED
    diehard_2dsphere|   2|      8000|     100|0.91557461|  PASSED
    diehard_3dsphere|   3|      4000|     100|0.10831747|  PASSED
     diehard_squeeze|   0|    100000|     100|0.58947448|  PASSED
        diehard_sums|   0|       100|     100|0.03804515|  PASSED
        diehard_runs|   0|    100000|     100|0.16852247|  PASSED
        diehard_runs|   0|    100000|     100|0.16901521|  PASSED
       diehard_craps|   0|    200000|     100|0.28860890|  PASSED
       diehard_craps|   0|    200000|     100|0.41000082|  PASSED

 marsaglia_tsang_gcd|   0|  10000000|     100|0.94040087|  PASSED
 marsaglia_tsang_gcd|   0|  10000000|     100|0.98666060|  PASSED
         sts_monobit|   1|    100000|     100|0.99649756|   WEAK
            sts_runs|   2|    100000|     100|0.06977154|  PASSED
... ...